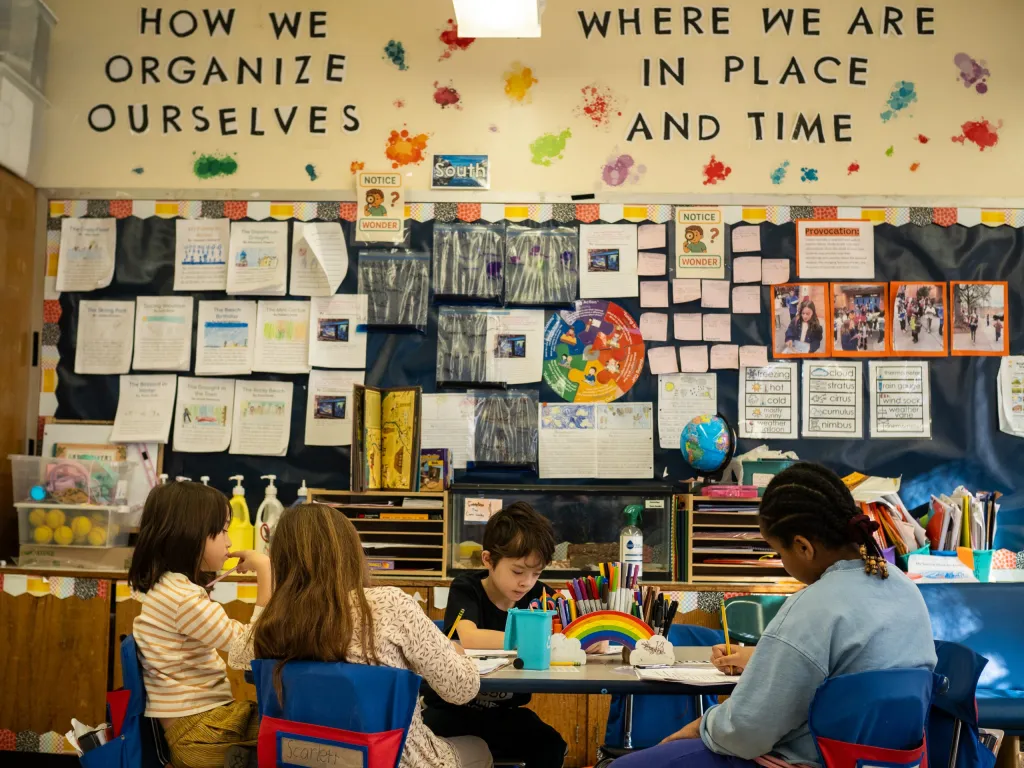
Unlike most other places in the nation, New York City families have to apply for schools at every level of their education, starting in kindergarten.
The choices can be overwhelming. The nation’s largest school system has about 670 elementary and 140 K-8 schools, roughly 250 standalone middle schools and nearly 90 6-12 schools, and more than 400 high schools with 700 programs. There are also 286 charter schools.
Heads up:
- High school admissions will run from Oct. 6 to Dec. 4, with SHSAT registration closing on Oct. 30. Offers will be sent March 4, 2027.
- Middle schools admissions will run from Oct. 14 to Dec. 11. Offers will be sent April 7, 2027.
- Kindergarten admissions will run from Dec. 9 to Jan. 22, 2027. Offers will be sent March 30, 2027.
- 3-K and pre-K admissions will run from Jan. 13 to Feb. 26, 2027. Pre-K offers will be sent May 11, 2027, and 3-K offers will be sent May 18, 2027.
Parents often make decisions based on their values, sense of a school’s academic quality, their children’s needs, and logistics. Some might want a school with a lot of hands-on work, a strong music program, or one that emphasizes student leadership. After-school options might be a priority, and sometimes even specific offerings, such as debate or chess. For some families, proximity to home is crucial.
But once you decide what’s important, how do you narrow down your list?
School officials put out a lot of public information, but where should you look? Which data is really important? If you visit, what should you ask?
At Chalkbeat New York and The City Reporter, it’s our jobs to know how the system works and report on the biggest issues facing schools and students. Education professionals, experts, and journalists can point to potential red flags, as well as certain qualities that parents could overlook.
In this guide, we’ll share what we know to help parents and guardians make informed decisions.
We’re also leading a live workshop on what’s in this guide for all New Yorkers who want to dive deeper, which you can attend in person or remotely. Want to join? Sign up here.
Ready to get started? Here’s what you need to know to vet a public school like a reporter.
Jump to …
The Big Ones: Where to look for a quick glance at potential red flags
Do teachers trust their principals?
Where to find it: NYC School Survey
Results from an annual school survey given to New York City parents, middle and high school students, and teachers offer a trove of information and helps you peer a bit into what’s happening under the surface. One data point, in particular, is often a proxy for how well a school is run: teacher-principal trust.
Nearly 67,000 teachers filled out the survey in spring 2026 and, overall, 87% of them felt positively about their principals. But drilling down on the school level can often reveal whether there’s strong and effective leadership, or tensions are bubbling up — issues that could spill over into the classroom, even if they might not be visible to families on school visits.
What else should we know about vetting a school? What else would you like to know? Reach out at ask@thecityreporter.nyc.
For example, at Brooklyn’s P.S. 307 — the school whose academic failings journalist Nikole Hannah-Jones captured in her essay about the choices she made for daughter — teachers clearly indicated some serious issues with their principal. In 2023, just 12% of teacher respondents said they felt “the principal/school leader at this school is an effective manager who makes the school run smoothly.”
The school has since gotten a new principal, and now 85% of the surveyed teachers felt the principal is effective.
Would teachers recommend the school?
Where to find it: NYC School Survey
Teachers know whether their school is functioning well, so you should check their response — also in the annual school survey — to the question about whether they would recommend the school to parents seeking a place for their child.
While 95% of teachers at nearly 540 city schools responding to the survey would recommend their schools to families, there were 56 schools where half or more of the respondents would not recommend their schools. That should raise concerns.
But larger factors can negatively skew this response, said Laura Zingmond, senior editor at InsideSchools, a free resource that offers nuanced reviews of schools across the city.
“There’s always an asterisk with that,” she said, “If you have a new principal … or whenever there’s a new initiative out, there’s always a dip.”
Are students showing up to class?
Where to find it: The city has annual data on attendance and chronic absenteeism rates.
If large numbers of students aren’t showing up regularly, that could raise questions about how well a school is engaging them. Sometimes when students don’t attend, their peers might feel less compelled to come to school, and teachers have to grapple with how to catch everyone up. When Chalkbeat investigated Murry Bergtraum, we looked closely at the chronic absenteeism rate and found that about three-quarters of students missed 10% of the school year.
There are some groups of students who face structural challenges that make it harder for them to come to class regularly, such as students who live in shelters or students with disabilities who rely on the city’s notoriously troubled busing system. But there are also schools that try everything they can to get kids to class.
Key data points to understand a school
Is the school helping students grow academically?
Where to find it: The school quality report dashboard. Take a look at the “impact and performance” chart at the top. Also, the state Education Department website includes lots of granular breakdowns for raw test scores but can take time to update with the latest numbers. Chalkbeat has an annual searchable database.
Test scores are often one of the first ways parents gauge school quality.
Students in grades 3-8 take annual state tests in reading and math. High school students take a series of state Regents exams in several subjects, though those tests are in the middle of a major overhaul and are being phased out as a graduation requirement.

But overall proficiency doesn’t tell you how well a school is helping its students learn — and is strongly correlated with a school’s demographics. Schools that serve students who are far behind, enroll many children who are learning English or live in temporary housing may help students make substantial progress even if their test scores are low.
Meanwhile, many New York City middle and high schools primarily admit students who already have strong academic records. High test scores at those campuses may not reveal much about the quality of the academic program.
So how can families get a sense of a school’s effect on student learning? A handy Education Department dashboard includes an “impact” calculation for each school. That metric attempts to show the effect a school has on student learning, while taking into account factors such as incoming students’ test scores (at least, in middle and high school), family poverty rates, disability status, and more.
Extra credit: For high school, Zingmond of InsideSchools suggests looking at the school quality snapshot to see how many students take advanced courses. For career and technical education schools, be sure to check how many students actually get CTE certifications. Instead of focusing on a school’s graduation rate, she advises families to look at a school’s College and Career Readiness, or CCR, rate, which takes into account how students do after four years at the school in terms of their grades, advanced courses completed, and certifications earned for CTE schools.
How does a school spend its money?
Where to find it: See a school’s per-pupil budget using the Education Department’s “Budget at a Glance” tool. A further breakdown can be found on a school’s Galaxy budget spending report. (To search, you’ll need a school’s four-digit code, which is a letter followed by three numbers you can find on the school’s official DOE page.)
Some parents might want to get under the hood and see how a school is spending its money. School budgets are largely based on enrollment, with additional dollars to serve those in poverty, with disabilities, and learning English.
Looking deeper into the budget, using the Galaxy budget spending reports, you can see whether a school employs a full-time librarian or art teachers. You can see whether the school has speech or occupational therapists on staff. You can also see the number of counselors and social workers. Teachers’ salaries, which are included in the budget, can give you some indication of how experienced the staff is. (Additionally, the school quality snapshot shows the percentage of teachers with more than three years of experience.)
A higher per-pupil budget doesn’t necessarily mean students are getting more resources. Smaller schools have had their budgets propped up by recent city policies that haven’t penalized them for falling enrollment. For example, at Murry Bergtraum, the city’s smallest traditional high school, the school received more than $46,000 per student last year. That’s roughly twice the citywide average, but the school isn’t able to offer the full complement of courses for a well-rounded high school experience.
And finally, there’s the money the school brings in outside of its city budget, often from parent fundraising, which can pay for enrichment programs, supplies, or staff outside of core academic subjects.
You can check how much your school’s PTA reported raising here.
Extra credit: If you’re interested in diving deeper into how the city determined a school’s funding, start here.
What does enrollment look like?
Where to find it: New York City’s annual demographic snapshot gives you the past five years of enrollment and demographic data. If you want to go back even further, check out the state Education Department’s school report cards.
More and more schools are underenrolled as the city’s student population shrinks.
Some families prefer small schools because their children might get more attention or have smaller class sizes. But if a school has been shrinking, it’s worth trying to understand why. Is it because it’s not performing well, or because the school-age population in the neighborhood is shrinking?

Also, in New York City’s highly segregated school system, schools can look a lot different from neighborhood to neighborhood, depending on who lives there — or even within the same neighborhood, depending on a school’s admissions policies. There can be segregation within schools, especially when they host programs like gifted and talented. You can find demographic data on the performance dashboard for a school, and you can dig into the specific breakdowns of special programs here.
Extra credit: Want to see if your school is bursting at the seams, or has classrooms that are mostly empty? Check out school capacity data from the School Construction Authority. And how about how crowded each classroom is? Check out class sizes here.
What about charter schools?
Where to find it: The New York City Charter School Center maintains a database of charter schools, including their demographics and test scores. The state’s Education Department also has a directory that includes financial statements, annual reports, and links to reports from the organizations that authorize each charter school and review their performance.
Charter schools are publicly funded and educate about 16% of the city’s public school students, but they operate differently than city-run district schools and have a separate admissions process. They are overseen by independent boards and have more freedom to set their own schedules, policies, and staffing.
In addition to many of the factors worth looking at for district schools — including academic growth, enrollment trends, and school survey results — it is worth looking at reports that are issued by the government entities that oversee each school, known as authorizers.
What else should we know about vetting a school? What else would you like to know? Reach out at ask@thecityreporter.nyc.
Charter schools must be renewed every few years, and their authorizers issue public reports that can reveal whether a school is serving its students well and if there are any red flags. The state Education Department directory often links to those reports, though you may have to dig a bit in some cases with each authorizer. (The State University of New York is the most common authorizer, but the state’s Board of Regents and New York City Education Department both oversee a chunk of charters.)
Since charter schools have more autonomy to set their own policies, it’s worth checking school websites to learn more. It’s also worth asking about their approach to homework, special education services, and student discipline.
Good to Know, But Ask More Questions
Is a school providing mandated special education services?
Where to find it: School quality reports list, under the “instruction and performance” tab, the percentage of students with disabilities receiving the services they are entitled to. The city also publishes information on how accessible each school building is for people with physical disabilities.
New York City public schools are required to serve students with disabilities, but their services and class sizes can differ. School quality reports provide some useful, though limited, information. They show whether a school is complying with students’ individualized education programs, or IEPs.
Compliance rates, however, should be interpreted cautiously. The city counts students as having received required services as long as they get them at some point in the year, which may obscure delays or interruptions.
Special education advocates recommend talking directly to school staff to get a feel for the school’s approach. Families may want to ask how teachers modify instruction, whether the school has experience serving students with needs similar to their child’s, and if it can provide everything required by the IEP.
“You can tell a lot by how someone talks,” said Kim Madden, the director of family support at Advocates for Children, which helps caregivers navigate the special education system.
Extra credit: Families can use the city’s class size reports to see what special education class sizes and staffing ratios a school has offered in the past. For example, if your child’s IEP calls for a 12-student class with a paraprofessional or a class that includes nondisabled students, the reports can show whether the school has experience offering that type of program. To find that information, open the “school” or “district” spreadsheets, then use the “K-5 Counts” or “MS HS Counts” tabs and filter by “program type.”
What does a school’s suspension rate look like?
Where to find it: The city Education Department’s suspension reports, which include school and citywide data.
Suspension statistics can offer clues about a school’s climate and approach to discipline but are unlikely to tell the full story. A school with a high suspension rate may have a particularly strict approach to student discipline, experience more frequent classroom disruptions, or rely more heavily on removing students from classrooms rather than using alternative methods of conflict resolution.
Still, a low suspension rate does not necessarily guarantee a disruption-free school environment. Some educators contend policy moves to reduce the number of suspensions can make it harder to deter disruptive behavior.
Other measures of school climate are worth considering alongside suspension data, including what teachers and students say on school surveys about safety and whether they feel supported.

Dig Deeper: What to look for on a school visit
Once you have a shortlist, you should try and visit those schools to get a stronger sense of whether it’s a fit for your family.
“What is the ‘vibe’ of the school? Is the security guard welcoming? What about the front office staff?” asked Pamela Wheaton, a co-founder of InsideSchools, who now consults on admissions through School Scout NYC.
Every school has a parent coordinator on staff who typically serves as a bridge between families and schools and can be your first point of contact when you have questions during application season.
Obviously, schools don’t want to be inundated with queries, but how — or even if — they answer might indicate how responsive they are.
If you visit, Wheaten advises parents of elementary school-age kids to look at the art on the wall to see what kinds of projects children are doing and whether it’s original artwork or mass produced worksheets. For middle school, she likes to see whether students are collaborating on projects or whether schools offer an advisory period, which is a dedicated time during the week to work on social emotional well-being.
For high school, she suggests looking at bulletin boards listing clubs and upcoming activities.
Here are some other questions to keep in mind as you think about or visit a school, or talk to other parents:
- What is the homework policy? And how much time is devoted to test prep?
Parents might have different opinions on homework — as do schools. Some elementary and even middle schools might have no homework. Often homework can vary from class to class, and it likely increases for more advanced classes. Some high schools have been trying to rein in homework — Stuyvesant High School, for instance, limits homework to 30 minutes a night per class. (But what might take one student 30 minutes might take another 15 minutes and another an hour.) It’s good to talk with current families about what homework looks like at a particular school. Schools often post their student handbooks online, which might tell you more about a school’s homework policy.
And parents might have different takes on test prep. Some schools pride themselves on offering extra time to help kids prepare for standardized tests, including Saturday academies. Other schools don’t spend much time on test prep.
- What does recess look like? And screen time?
Schools are not required to publicly post their recess policies, and while there’s no requirement for recess, the Education Department’s wellness policy “strongly recommends” that elementary schools offer at least 20 minutes of recess for all students “on all or most days during the school year.” (It doesn’t include any recommendations for middle or high school.) And families, in recent years, have increasingly complained about their kids watching screens during recess instead of going outside.
- Is vaping an issue?
Middle and high school parents often are concerned about vaping on campus. It’s unlikely that school staffers will admit to that during a school tour, but the 2026 school survey, for the first time, asked students about vaping. (You can find this listed under “additional questions” in a school’s student survey results.)
- What’s the school’s ratio of guidance counselors to students?
Guidance counselors often wear many hats. They not only address students’ social emotional well-being and work with children who are mandated for extra support, they also support students who are about to graduate. So having an accessible guidance counselor tends to be a big help.
Experts recommend a ratio of 250 students per counselor — and even fewer students per counselor for high-needs schools. New York City’s Education Department is required to share data every year of the number of guidance counselors (and social workers) at each school, and the ratio of counselors to students.
What else should we know about vetting a school? What else would you like to know? Reach out at ask@thecityreporter.nyc.
Our nonprofit newsroom relies on donations from readers to sustain our local reporting and keep it free for all New Yorkers. Donate to THE CITY today.
The post How to Vet an NYC Public School Like a Reporter appeared first on The City Reporter.