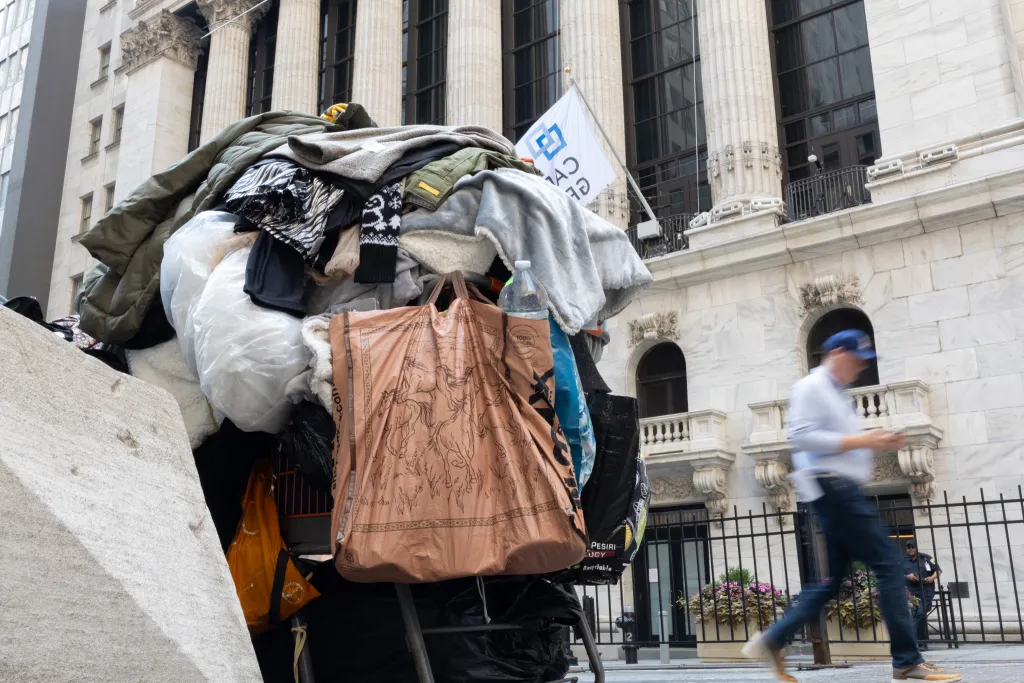
Millionaires who captured more than half of all of New York City’s income growth since the pandemic.
A poverty rate that keeps climbing and is much higher than the nation as a whole.
Stratospheric Wall Street profits.
Record numbers of New Yorkers receiving cash assistance and SNAP benefits.
The image suggested by these data points and more in the charts below is a K. An upward-sloping line that shows the gains by the few. And a downward-sloping line showing the deteriorating financial well-being of so many others.
The K-shaped economy, a concept popularized in 2020 by William & Mary economist Peter Atwater, is a national issue.
And as the election victories by Mayor Zohran Mamdani and his fellow democratic socialists show, its impact goes far beyond the economy.
The Rich ‘Feel Invulnerable’
“The reason the K-shaped economy matters isn’t because of what it says about wages or wealth, but what it says about how people feel and their life experience,” Atwater told The City Reporter.
“Today, those at the top feel invulnerable. Moreover, they have an overabundance in everything that matters,” he said. “Meanwhile, those at the bottom feel increasingly powerless and uncertain. They see scarcity in every direction they turn.”
Top officials in the Trump administration dismiss the whole idea.
“I can say here definitively, the K-shaped economy is over,” Treasury Secretary Scott Bessent said on CNBC’s “Squawk Box” last month, arguing that wages are growing fastest for low-paying jobs.
But even if that is more than a statistical blip, it’s not true for New York City.
“The way finance and tech are growing today, coupled with wage stagnation for most workers, makes the post-pandemic NYC economy more polarized than ever,” James Parrott, senior advisor to the Center for New York City Affairs at the New School, said in an email.
The data and charts in this story show that the K shape may be the defining symbol of the city’s economy.
What follows is a series of data charts that show New York City’s extreme K, with an emphasis on income, the rise in New Yorkers’ reliance on safety net benefits, and the divergence in real estate ownership.
Growing Income Inequality and Poverty
The city’s top 1%, or some 40,700 millionaires, captured 53% of income growth over five years. Since 2019, the rate of income growth has ramped up for the city’s wealthiest, while it has slowed for the 99%.
(function(){function e(){window.addEventListener(`message`,function(e){if(e.data[`datawrapper-height`]!==void 0){var t=document.querySelectorAll(`iframe`);for(var n in e.data[`datawrapper-height`])for(var r=0,i;i=t[r];r++)if(i.contentWindow===e.source){var a=e.data[`datawrapper-height`][n]+`px`;i.style.height=a}}})}e()})();
Meanwhile, poverty has reached a record high for the third consecutive year in 2024, double the national rate.
More New Yorkers have turned to federal and state aid for health insurance and food, but many are losing access to the programs. Cash assistance enrollment has climbed steadily as more rely on the safety net, but thousands are losing benefits due to federal cuts to Medicaid and work requirement restrictions to SNAP.
(function(){function e(){window.addEventListener(`message`,function(e){if(e.data[`datawrapper-height`]!==void 0){var t=document.querySelectorAll(`iframe`);for(var n in e.data[`datawrapper-height`])for(var r=0,i;i=t[r];r++)if(i.contentWindow===e.source){var a=e.data[`datawrapper-height`][n]+`px`;i.style.height=a}}})}e()})();
“The cost of living in New York City, quite frankly, even if you had a full-time job and weren’t on SNAP benefits, it’s very challenging these days. Food inflation, the prices in grocery stores, people cannot afford [them] anymore,” said Lakisha Morris, division director for food and housing stability at Catholic Charities.
“You’re making decisions on whether three of us are going to eat tonight or I’m just going to feed my two kids. And these are true, hard facts,” she said. “There is no immediate relief. People are challenged. And the jobs that are paying a better living wage are hard to come by these days.”
(function(){function e(){window.addEventListener(`message`,function(e){if(e.data[`datawrapper-height`]!==void 0){var t=document.querySelectorAll(`iframe`);for(var n in e.data[`datawrapper-height`])for(var r=0,i;i=t[r];r++)if(i.contentWindow===e.source){var a=e.data[`datawrapper-height`][n]+`px`;i.style.height=a}}})}e()})();
The top 1%, meanwhile, are doing better than ever. Homeownership used to be the pinnacle of the American Dream. Now homeownership feels unreachable for younger Americans.
(function(){function e(){window.addEventListener(`message`,function(e){if(e.data[`datawrapper-height`]!==void 0){var t=document.querySelectorAll(`iframe`);for(var n in e.data[`datawrapper-height`])for(var r=0,i;i=t[r];r++)if(i.contentWindow===e.source){var a=e.data[`datawrapper-height`][n]+`px`;i.style.height=a}}})}e()})();
Speaking of Home Ownership…
The real estate market has seen signs of distress as more and more New Yorkers struggle to afford homes amid a booming luxury market. Manhattan is a prime example. Over the last year, the overall housing market saw an 8.2% loss, but contracts and listings for ultra-luxury homes have proliferated, with $5 million and $10 million+ homes dominating.
“I would expect to have an increase in home sales at that price point this year, even as the total number of sales in New York is flat,” said Mike Simonsen, chief economist at COMPASS, a real estate brokerage.
“Those forces still seem to be underway, and there has to be some dramatic change in policy or macroeconomic conditions before that changes,” he said.
(function(){function e(){window.addEventListener(`message`,function(e){if(e.data[`datawrapper-height`]!==void 0){var t=document.querySelectorAll(`iframe`);for(var n in e.data[`datawrapper-height`])for(var r=0,i;i=t[r];r++)if(i.contentWindow===e.source){var a=e.data[`datawrapper-height`][n]+`px`;i.style.height=a}}})}e()})();
The vast majority of New Yorkers are renters — 69% of households rent their homes, according to a 2024 report from the city comptroller — but the cost of rent has steadily outpaced income growth.
(function(){function e(){window.addEventListener(`message`,function(e){if(e.data[`datawrapper-height`]!==void 0){var t=document.querySelectorAll(`iframe`);for(var n in e.data[`datawrapper-height`])for(var r=0,i;i=t[r];r++)if(i.contentWindow===e.source){var a=e.data[`datawrapper-height`][n]+`px`;i.style.height=a}}})}e()})();
This means more New Yorkers are falling into lower income brackets and becoming severely rent-burdened, spending half or more of their household income on rent.
(function(){function e(){window.addEventListener(`message`,function(e){if(e.data[`datawrapper-height`]!==void 0){var t=document.querySelectorAll(`iframe`);for(var n in e.data[`datawrapper-height`])for(var r=0,i;i=t[r];r++)if(i.contentWindow===e.source){var a=e.data[`datawrapper-height`][n]+`px`;i.style.height=a}}})}e()})();
‘You’re Either Poor or Rich’
Only high-wage industries, or the top 20% of workers, saw their hourly wage growth outpace inflation. Middle-wage workers saw their income stagnate or decline from 2024 to 2025 while top earners captured nearly all wage growth.
“It’s basically the almost-disappearance of the middle class. You’re either poor or rich,” said Mohamed Obaidy, economist and associate director of the Center for NYC Affairs.
“These are characteristics of developing countries… what this means for New York City is we’re coming backwards and becoming more of a developing country.”
(function(){function e(){window.addEventListener(`message`,function(e){if(e.data[`datawrapper-height`]!==void 0){var t=document.querySelectorAll(`iframe`);for(var n in e.data[`datawrapper-height`])for(var r=0,i;i=t[r];r++)if(i.contentWindow===e.source){var a=e.data[`datawrapper-height`][n]+`px`;i.style.height=a}}})}e()})();
The majority of jobs have also been low-wage labor, with exceptions in healthcare. High-wage industries grew slowly, adding comparatively fewer roles.
(function(){function e(){window.addEventListener(`message`,function(e){if(e.data[`datawrapper-height`]!==void 0){var t=document.querySelectorAll(`iframe`);for(var n in e.data[`datawrapper-height`])for(var r=0,i;i=t[r];r++)if(i.contentWindow===e.source){var a=e.data[`datawrapper-height`][n]+`px`;i.style.height=a}}})}e()})();
But in the last two years, higher-wage sectors like finance, tech, and consulting captured the largest wage and job growth.
(function(){function e(){window.addEventListener(`message`,function(e){if(e.data[`datawrapper-height`]!==void 0){var t=document.querySelectorAll(`iframe`);for(var n in e.data[`datawrapper-height`])for(var r=0,i;i=t[r];r++)if(i.contentWindow===e.source){var a=e.data[`datawrapper-height`][n]+`px`;i.style.height=a}}})}e()})();
The Price Tag For NYC Kids
This means that households must have working adults in higher-wage industries to exceed the living wage to support a child. Not a single industry’s average wage is enough to cover the cost of a child. In two-person households where only one adult is working, only those in management, professional, or tech industries can support a child. If two adults work, average wages for most industries pay enough, but some lower-wage industries do not.
(function(){function e(){window.addEventListener(`message`,function(e){if(e.data[`datawrapper-height`]!==void 0){var t=document.querySelectorAll(`iframe`);for(var n in e.data[`datawrapper-height`])for(var r=0,i;i=t[r];r++)if(i.contentWindow===e.source){var a=e.data[`datawrapper-height`][n]+`px`;i.style.height=a}}})}e()})();
Greg David and Kennedy Sessions contributed to this story.
Our nonprofit newsroom relies on donations from readers to sustain our local reporting and keep it free for all New Yorkers. Donate to THE CITY today.
The post Inside NYC’s K-Shaped Economy: A Few Do Well, Most Do Not appeared first on The City Reporter.